Motivation
As part of the work for my dissertation, I am building a tool that allows users to edit a Markov Decision Process (MDP). This relates to my paper, Level Assembly as a Markov Decision Process. This work is different because I am representing the MDP as a graph. Every node in the graph is a state, and a state is a level segment. Every edge represents an action. Levels are formed by connecting states together. I also have some metadata in the edges, which are links between level segments.
The UI had a couple of requirements:
- Nodes are related to text files
- Nodes need an editable field for
reward - Nodes can be connected to each other with directed edges
- Nodes can be moved throughout the user interface
To do this, I made the decision to use Tkinter based on two factors. One, I’ve used it before with some success. Two, Tkinter has an easy way to draw arrows: create_line. The function can be passed an argument to put an arrow at either the beginning or the end.
The process was fairly smooth, and I don’t want to write about simple things like how to draw a rectangle when that information is readily available online. Instead, this post is on the problem I ran into after implementing the above requirements.
The Problem
 Sample graph in the editor.
The picture above hints at the problem with making a node graph editor: the size of the graph. An editor implementing only the above requirements is fine if the graph is small. However, a graph with 100 nodes won’t fit inside the screen. Therefore, the UI needs a way for the user to pan around the UI. Ideally, they could also zoom in or out to get a birds-eye-view of the graph. It’s a feature seen in most node graph editors, but the standard functions from Tkinter weren’t getting the job done for me. So, I had to implement panning and zooming myself.
Implementing Panning
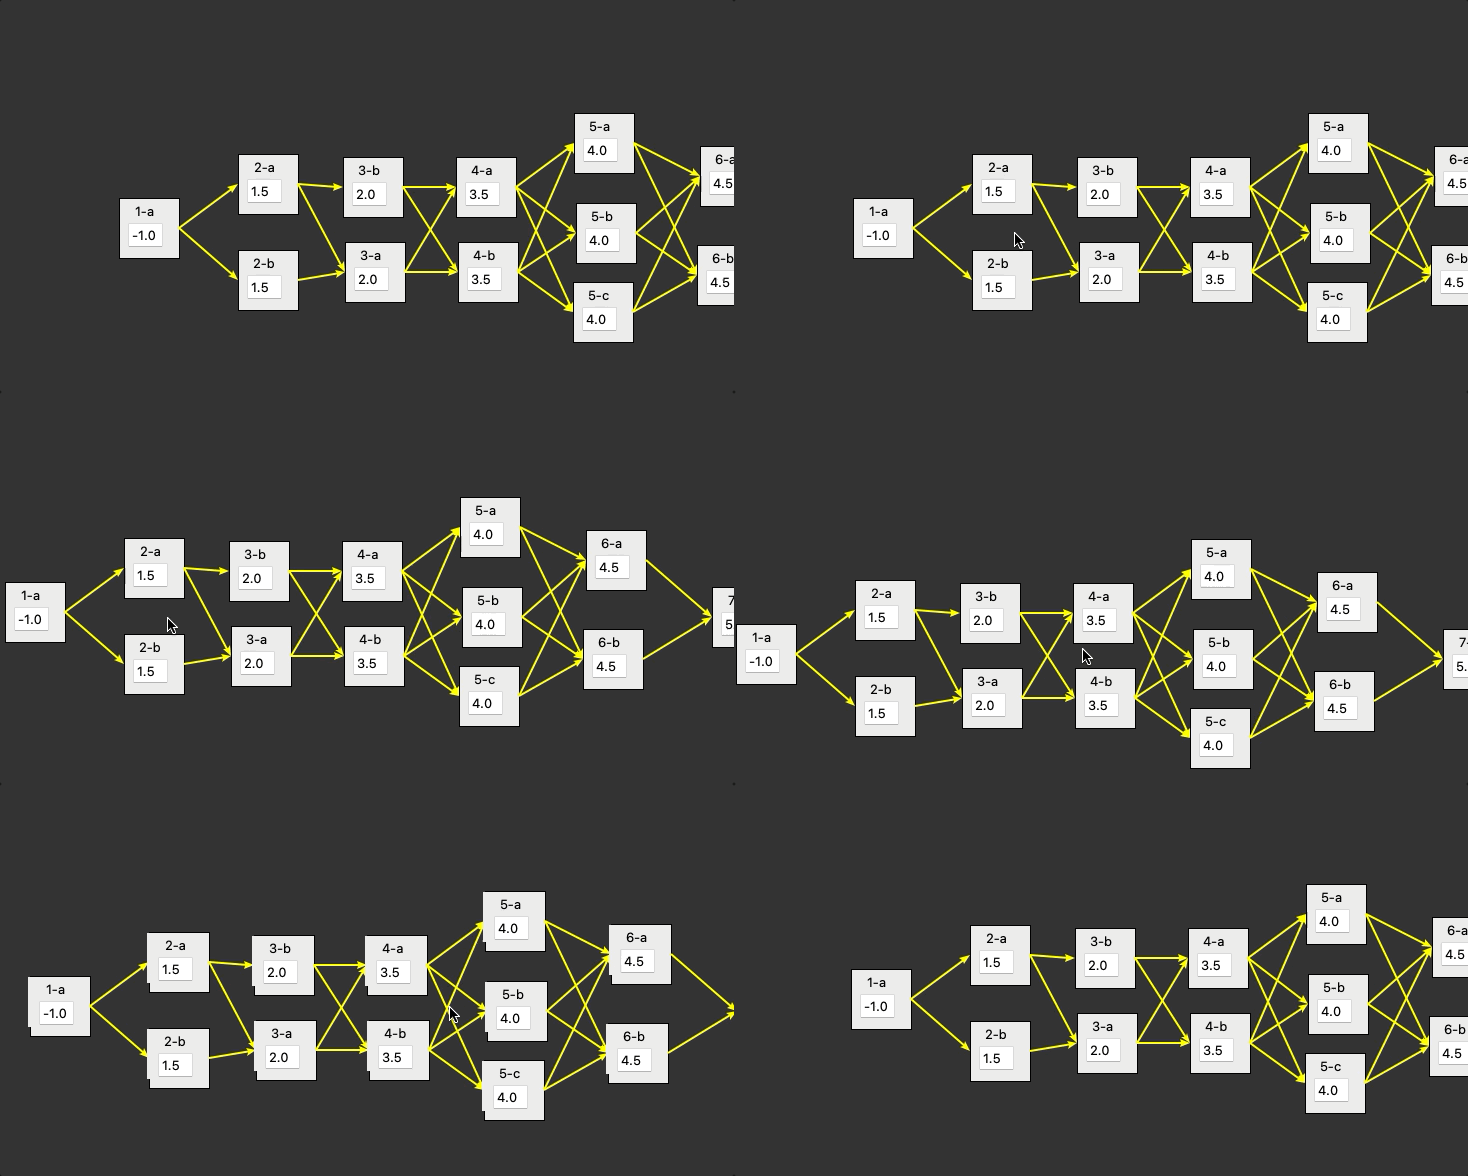
 Example of panning. Without meaning to, I almost made a perfect loop.
I used pressing down on the mouse wheel for panning. It’s maybe not the most friendly design choice for laptop and Apple users, but the tool is mainly for my use anyway, so I decided to go with what felt natural. To do this, you have to bind some functions with Tkinter.
self.root.bind("<Button-3>", self.pan_start)
self.root.bind("<B3-Motion>", self.pan)
The first function, pan_start, is very simple. It marks the location of the mouse when the mouse wheel is pressed.
def pan_start(self, event):
    self.pan_x = event.x
    self.pan_y = event.y
The second function, pan, runs for as long as the mouse wheel is pressed down.
def pan(self, event):
    dx = event.x - self.pan_x
    dy = event.y - self.pan_y

    for N in self.G.nodes.values():
        self.move_node(N, dx, dy)

    self.pan_x = event.x
    self.pan_y = event.y
It calculates the difference between the previous mouse position and the current one, uses it inside the for loop, and updates the mouse position for the next frame. The more complicated part is in the function called in the for loop: move_node.
def move_node(self, n: CustomNode, dx: float, dy: float):
    ## Update rectangle placement
    self.canvas.move(n.rect_id, dx, dy)
    self.canvas.itemconfig(n.rect_id, tags=("rect", "dragged"))

    x1, y1, _x2, _y2 = self.canvas.coords(n.rect_id)
    n.frame.place(x=x1+self.scale, y=y1+self.scale)
    n.x += dx
    n.y += dy

    ## Update Edge coordinates
    # outgoing
    for tgt in n.neighbors:
        line_id = self.G.get_edge(n.name, tgt).line_id
        coords = self.canvas.coords(line_id)
        self.canvas.coords(
            line_id,
            x1 + NODE_WIDTH * self.scale,
            y1 + NODE_HEIGHT / 2 * self.scale,
            coords[2],
            coords[3]
        )

    #incoming
    for edge in self.G.incoming_edges(n.name):
        coords = self.canvas.coords(edge.line_id)
        self.canvas.coords(
            edge.line_id,
            coords[0],
            coords[1],
            x1,
            y1 + NODE_HEIGHT / 2 * self.scale
        )
You’ll notice the class CustomNode in the function definition. That is an extension to Node, which is part of a library I made called GDM. The specifics aren’t important, but having a tool that modeled a graph underneath the UI representation improved my life when implementing panning and zooming. You’ll also notice the use of the self.scale variable, which is relevant for the next section, so just ignore it for now.
move_node works in two sections. The first section moves the node. The second section moves the edges, incoming and outgoing. Starting with the node, you can see that the rectangle and the frame—the frame has the label (i.e., the title of the node) and the entry field for the reward. Moving those is all that is necessary for the UI to be updated. After that, you can see that the node’s x and y coordinates were updated. This is for the underlying data in the node graph. While this was not strictly necessary, a bit of data duplication made working with Tkinter way more easy. This consideration, and ones like it, were why I ultimately regretted the choice of using Tkinter. In hindsight, I should have used pygame or something more like it, and my life would have been a lot better overall.
The second part updates incoming and outgoing edges. The underlying data structure of a graph with GDM made it very simple to find these edges. Each edge also had a member variable line_id, which was how the UI for the edge could be accessed. The code in both for loops updates the relevant coordinates based on where the node was just moved to. It does not update both because that is relevant to another node, which may or may still need to be moved.
With that done, you can see the behavior in the gif above.
Implementing Zooming In and Out
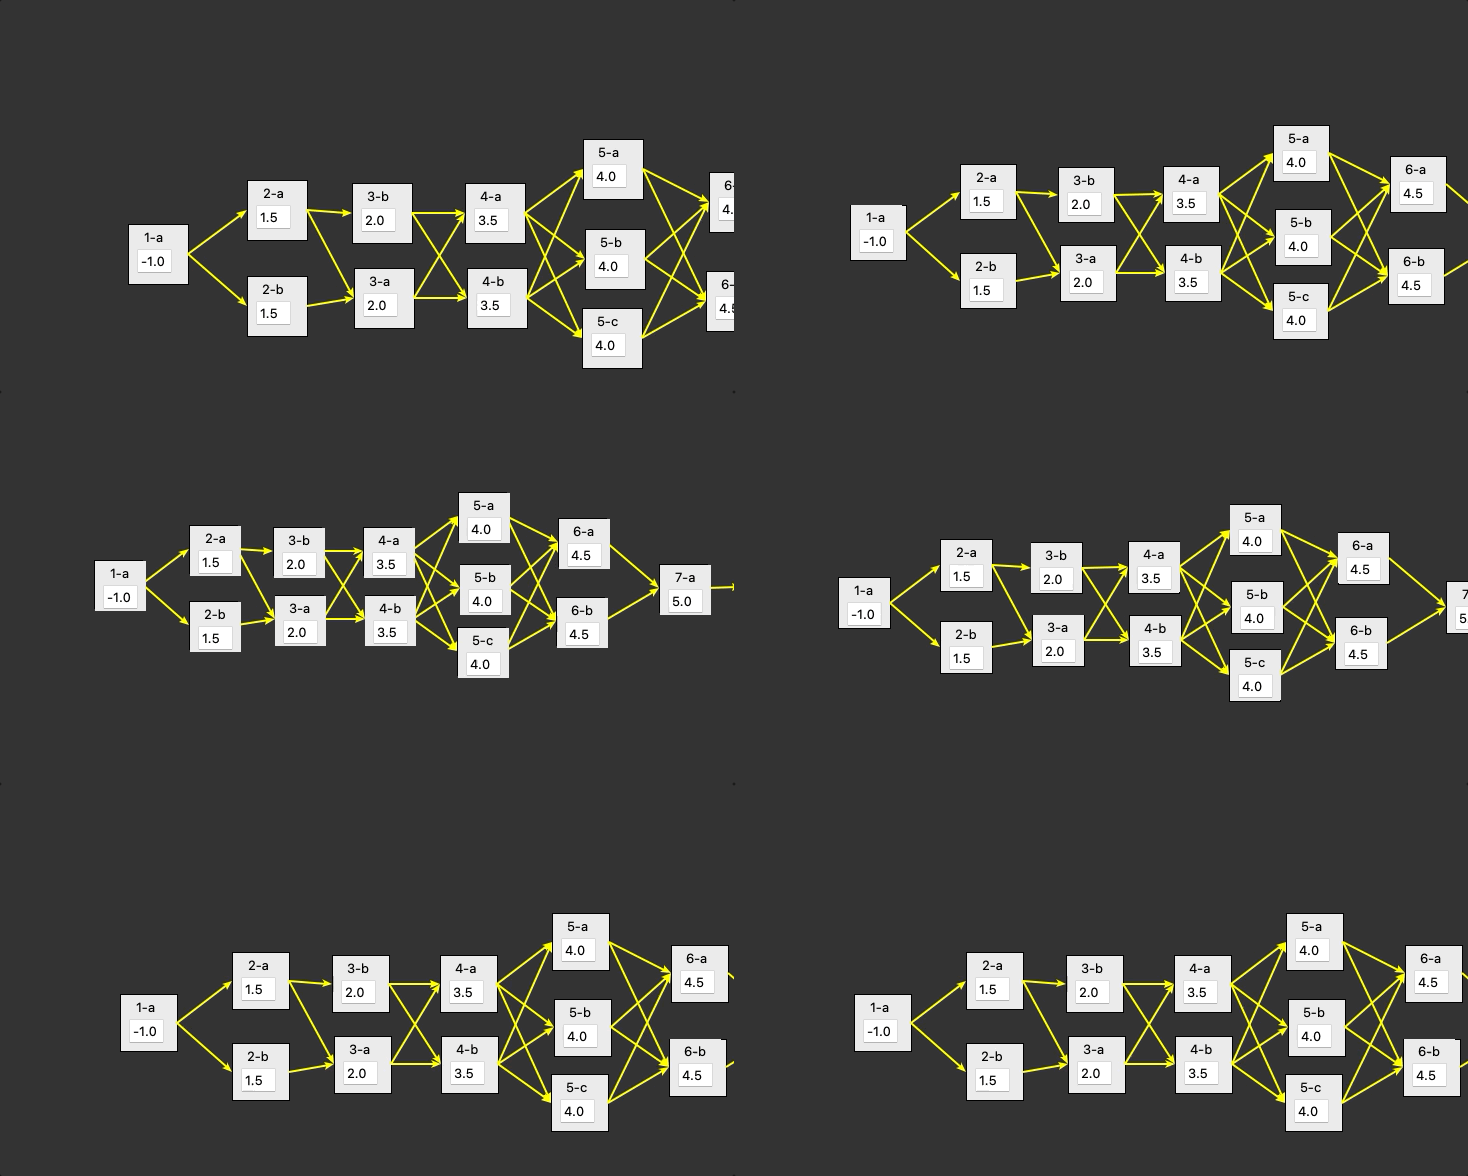
 Example of zooming in and out.
I bound the mouse wheel for zooming in and out:
self.root.bind("<MouseWheel>", self.scale)
You’ll notice the use of the word scale instead of zoom. This is because I decided to not implement zooming in and out exactly like what you see in something like Google Maps. In that version of zooming, you zoom in or out based on the mouse location. Instead, I decided to be easier on myself and affect the scale. This is still very similar to zooming in and out, but not exactly. The effect can be seen in the gif above, where everything gets smaller and goes towards the top left. This is because the top left is the origin (0,0). Unsurprisingly, things multiplied by a number less than 1 will go towards 0.
def scale(self, event):
    delta = 1 if event.delta >= 0 else -1
    self.scale = min(1.0, max(0.1, self.scale + 0.01*delta))
    # remaining code...
This takes us to the top part of the scale function. It uses event.delta to tell if the user has scrolled up or down. This then changes the multiplier to -1 or 1. The scale is either added to or subtracted by 0.01 with a min of 0.1 and a max of 1.0. After that, the code below for scaling is almost exactly the same as the move_node code. In fact, they are almost exactly the same, but there are some tiny differences. If I was more of a perfectionist, I would change the name of move_node to update_node. Then, I would update the the code so that both pan and scale used update_node. However, I am not a perfectionist, and this code is only being used by me. So, I’m going to leave it as is.1
def scale(self, event):
    delta = 1 if event.delta >= 0 else -1
    self.scale = min(1.0, max(0.1, self.scale + 0.01*delta))

    n: CustomNode
    for n in self.G.nodes.values():
        ## Update Node
        # rectangle
        self.canvas.coords(
            n.rect_id,
            n.x * self.scale,
            n.y * self.scale,
            (n.x + NODE_WIDTH) * self.scale,
            (n.y + NODE_HEIGHT) * self.scale
        )

        # frame
        n.frame.place(
            x = (n.x + 1) * self.scale,
            y = (n.y + 1) * self.scale
        )

        # entry
        n.entry.config(width=ceil(3*self.scale))

        ## Update Edge coordinates
        # outgoing
        for tgt in n.neighbors:
            line_id = self.G.get_edge(n.name, tgt).line_id
            coords = self.canvas.coords(line_id)
            self.canvas.coords(
                line_id,
                (n.x + NODE_WIDTH) * self.scale,
                (n.y + NODE_HEIGHT / 2) * self.scale,
                coords[2] ,
                coords[3]
            )

        for edge in self.G.incoming_edges(n.name):
            coords = self.canvas.coords(edge.line_id)
            self.canvas.coords(
                edge.line_id,
                coords[0],
                coords[1],
                n.x * self.scale,
                (n.y + NODE_HEIGHT / 2) * self.scale
            )
The tedious part of this problem was that every piece of the code that involved coordinates had to be updated. I am not going to go over every piece of code that had to be updated, though. If you are interested, the code is on GitHub. Just search for self.scroll, and you can see all the uses. (There are 16 in total.) There isn’t anything complicated once you see it.
Conclusion
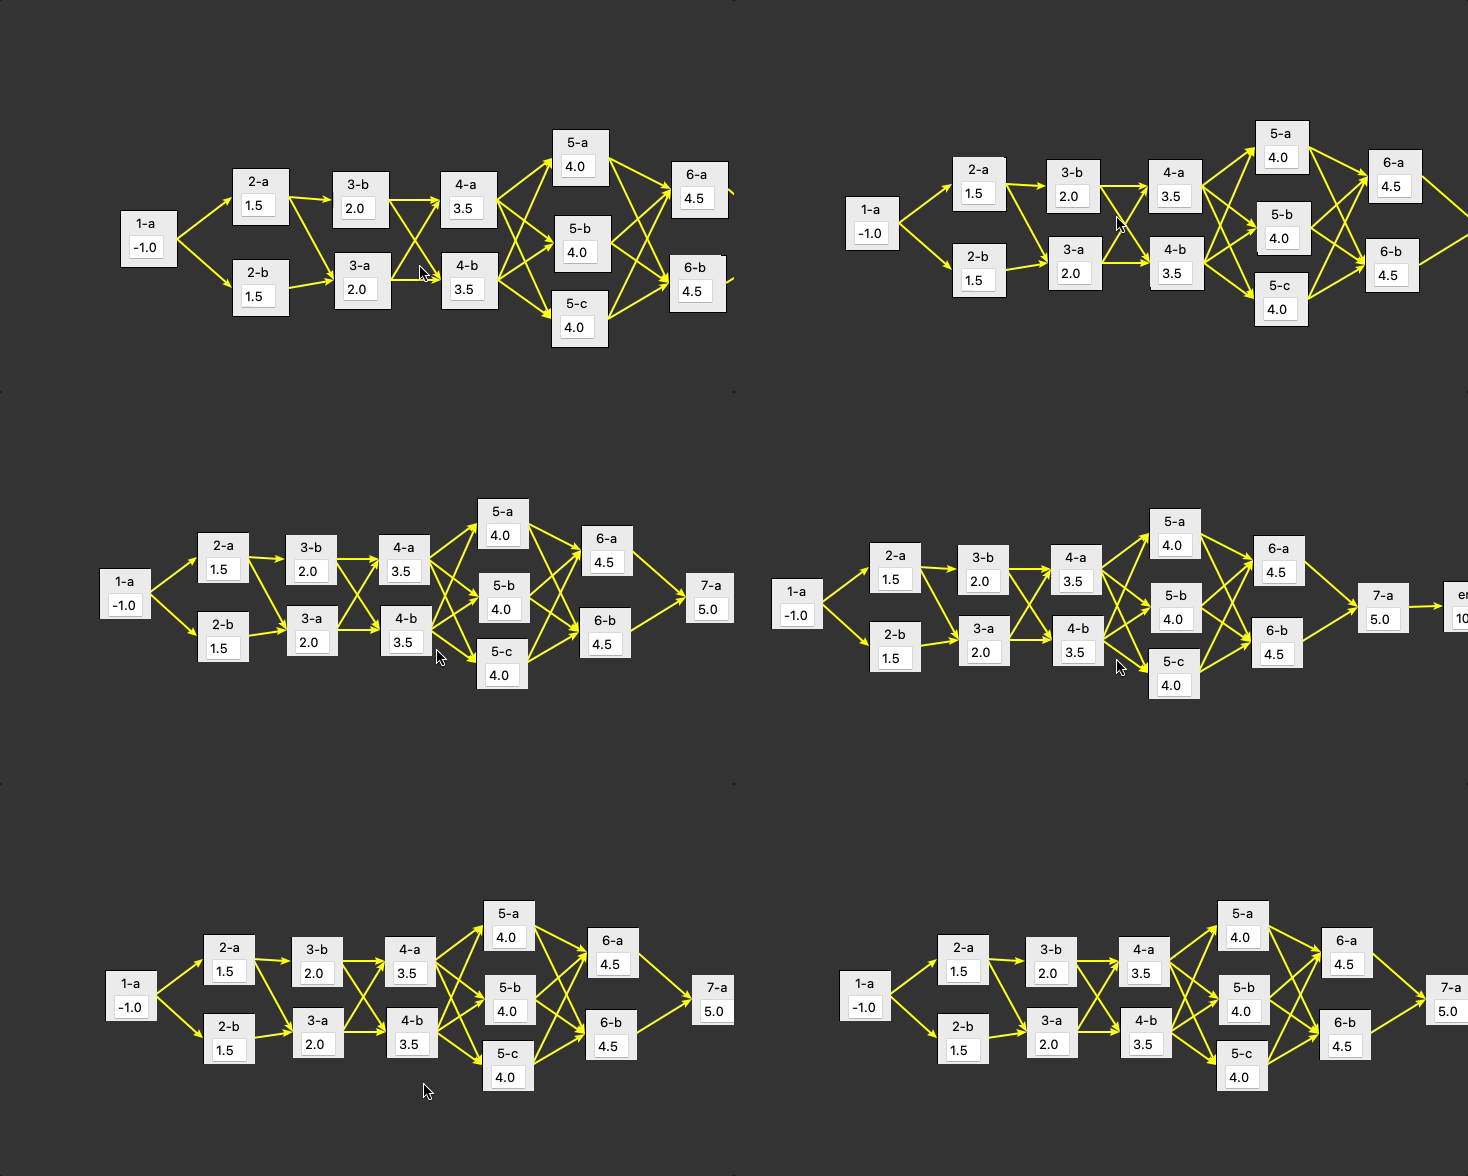
 Example of zooming and panning together.
One particular problem I ran into was combining panning and zooming. Before I had the implementation right, I had arrows flying around to all sorts of wrong coordinates. Again, the solution wasn’t complex or particularly difficult to find. It just took fiddling with the implementation to find where I had made mistakes or forgotten to add a multiplication by self.scale. So, the conclusion here is that panning and scaling are not hard to implement. Tedious for sure, but not hard.